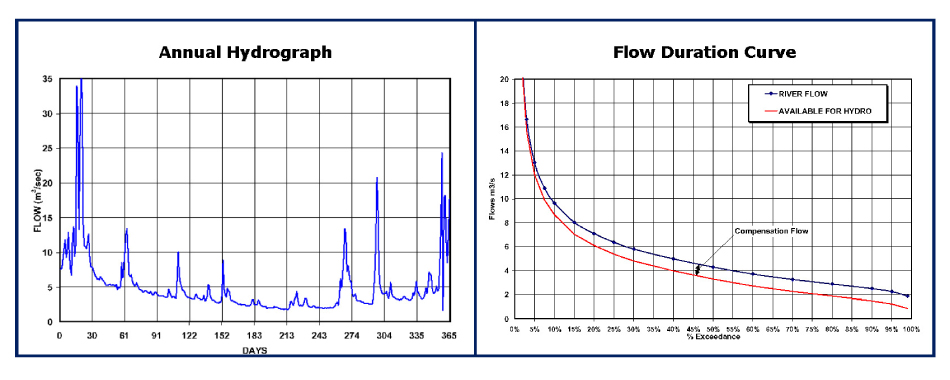
There are two ways of expressing the variation in river flow over the year: the annual hydrograph and the Flow Duration Curve or FDC, as illustrated below.
The annual hydrograph is the easiest to understand, since it simply shows the day-by-day variation in flow over a calendar year. However, the FDC is more useful when calculating the energy available for a hydro-power scheme.
The FDC shows how flow is distributed over a period (usually a year). The vertical axis gives the flow, the horizontal axis gives the percentage of the year that the flow exceeds the value given on the y-axis.
Hence, for example, the FDC can immediately indicate the level of flow that will be available for at least 50% of the year (known as Q50). The flow exceeded for 95% of the year (Q95) is often taken as the characteristic value for minimum river flow.
FDCs are often very similar for a region, but can be affected by soil conditions, vegetation cover, and to a lesser extent by catchment shape. They are also modified by man-made reservoirs, abstractions and discharges.
A flatter FDC (characterising a heavily spring-fed river) is preferable to a steeply sloping one, and means that the total annual flow will be spread more evenly over the year, giving useful flow for a longer period, and less severe floods.
Compensation Flow
A portion of the flow, historically called the compensation flow (but now also referred to as the ‘residual’, ‘reserved’, ‘prescribed’ or ‘hands-off’ flow), may need to by-pass the scheme for aesthetic or environmental reasons. In schemes where water is diverted from the main course of the river this compensation flow is needed to maintain the ecology and aesthetic appearance of the river in the depleted stretch.